There are sample data about the depth of plowing fields under a
Content: 40420183348190.zip (56.97 KB)
Uploaded: 20.04.2014
Positive responses: 0
Negative responses: 0
Sold: 5
Refunds: 0
$2
CHALLENGE
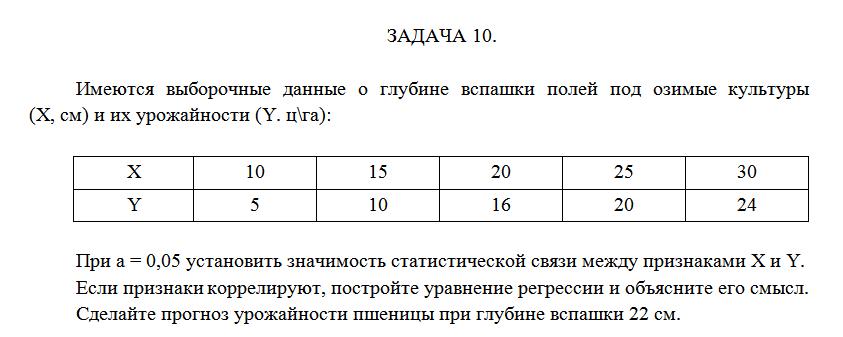
There are sample data about the depth of plowing the fields for winter crops (X, cm) and yield (Y. n \\ n):
X 10 15 20 25 30
Y May 10 16 20 24
For a = 0.05 to establish the significance of the statistical relationship between the signs of X and Y.
If symptoms are correlated, build the regression equation, and explain its meaning.
Make a forecast yield of wheat in the plowing depth of 22 cm.
CHALLENGE
There are sample data about the depth of plowing the fields for winter crops (X, cm) and yield (Y. n \\ n):
X 10 15 20 25 30
Y May 10 16 20 24
For a = 0.05 to establish the significance of the statistical relationship between the signs of X and Y.
If symptoms are correlated, build the regression equation, and explain its meaning.
Make a forecast yield of wheat in the plowing depth of 22 cm.
No feedback yet